Start spring by having fun and learning something new!
Start spring by having fun and learning something new!
Recently, customers have asked if our tea is "all right". Many are worried that our tea supply might be disrupted due to the current troubles in Japan (Thank you for liking our tea so much!) and not a few voiced out concerns about elevated radiation levels affecting the tea...which I believe is a very valid concern.
First of all, all the tea being sold right now are from last year’s harvest. This year’s spring harvest has not begun yet. (Normally it is around latter part of April.)
But will 2011 harvest be bad? No.
Our tea is farmed in Kyoto. Kyoto is about 670 km from Sendai and is about 600 km from the Fukushima Dai-ichi Nuclear Power Plant. Kyoto did not suffer any damage from the earthquake. Kyoto is not experiencing higher than normal radiation levels. Our tea is shipped out of Kansai International Airport (in Osaka) which is also far from affected areas.
Our promise: If we hear of any kind of incident/news that will have an adverse affect on our tea supply, we will be the first one to pull the plug. [See also “Part 2” of why our tea is safe: /theikebanashop/our-tea-is-safe-part-2]
We are monitoring the situation closely. But please don't take our word for it. The internet can provide almost real-time information. The following links we found most useful to check on radiation levels in Kansai (the Kyoto-Osaka region). We are sure there are still other sources out there.
http://gebweb.net/japan-radiation-map/
http://www.aris.pref.kyoto.jp/map_00.html (Japanese only)
http://www.o-ems.pref.osaka.jp/ (Japanese only)
Below are snapshots (taken on 3/29) of some data.
Below is what radiation levels measured in Kyoto looked like in the past month (from 3/29 back). Note that the earthquake happened on 3/11. All six locations are on the northern part of Kyoto. The purple line graph is the radiation level measured in nGy/hr (the left Y-axis). The bar graph is the amount of rain measured in mm (the right Y-axis). For reference, on the left Y-axis, you’ll see some diamond marks. The purple diamond is last year’s highest measured level. The green diamond is last year’s average level. The blue diamond is last year’s lowest level.
Please note that 10~200 nGy/hr is the normal range. Let’s do the math... 200 nGy/hr x 24 hrs x 365 days = 1.752 million nGy for a year...which is well within the 2 million nGy/year estimate of typical background radiation experienced by the average person.
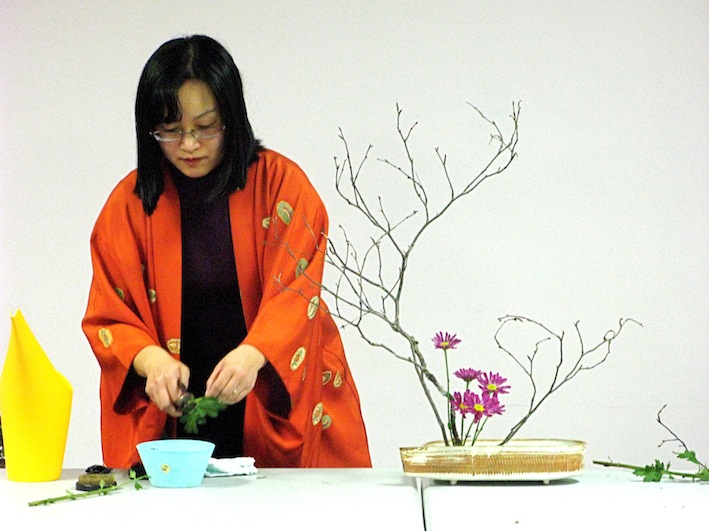
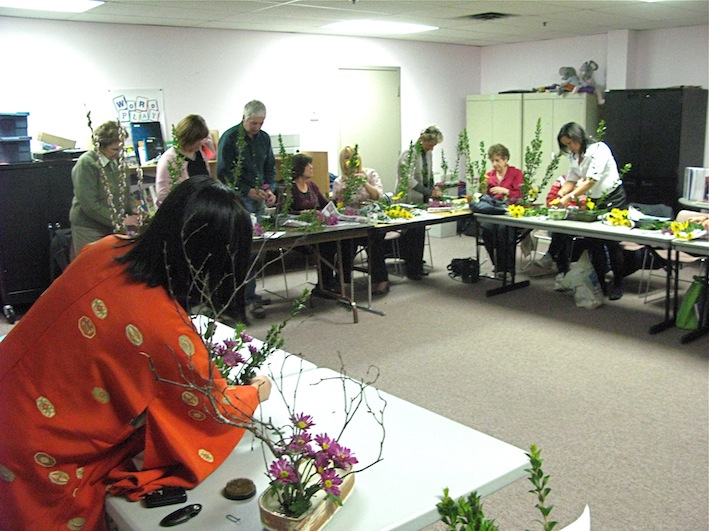
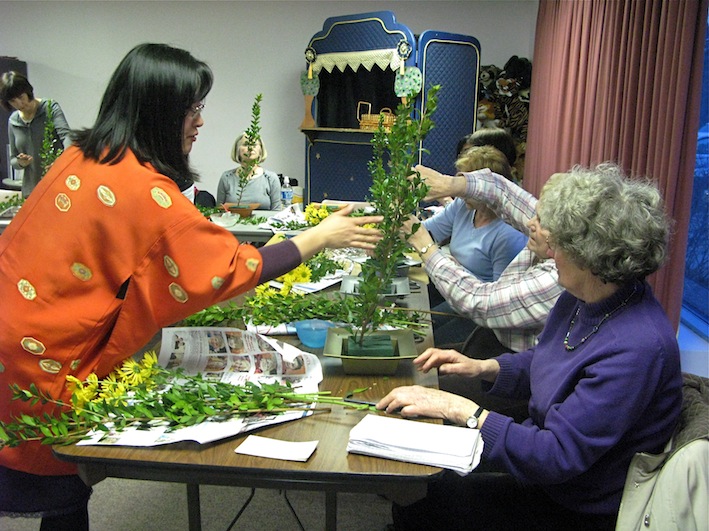
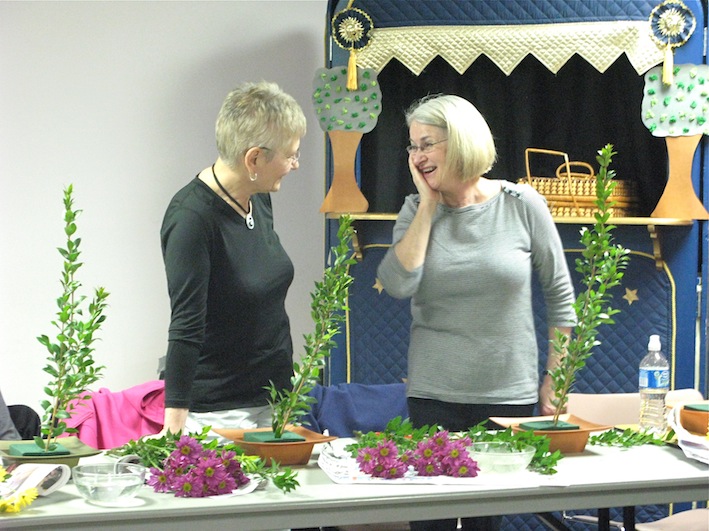
Thank you very much to all participants of the ikebana workshop at the Bedford Public Library last night. We hope you enjoyed it!
Thank you to the Halifax Public Libraries for letting us participate in the Art Attack program.
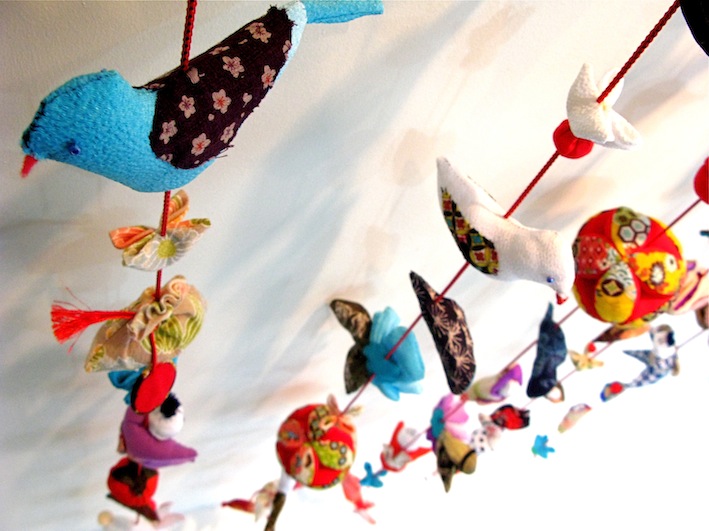
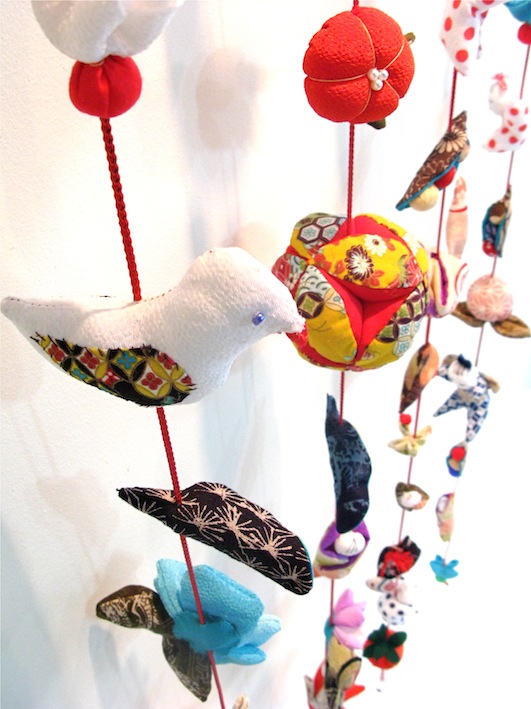
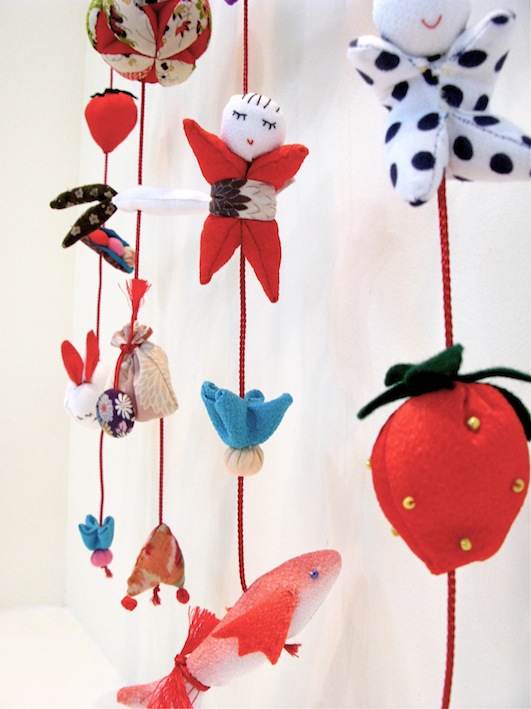
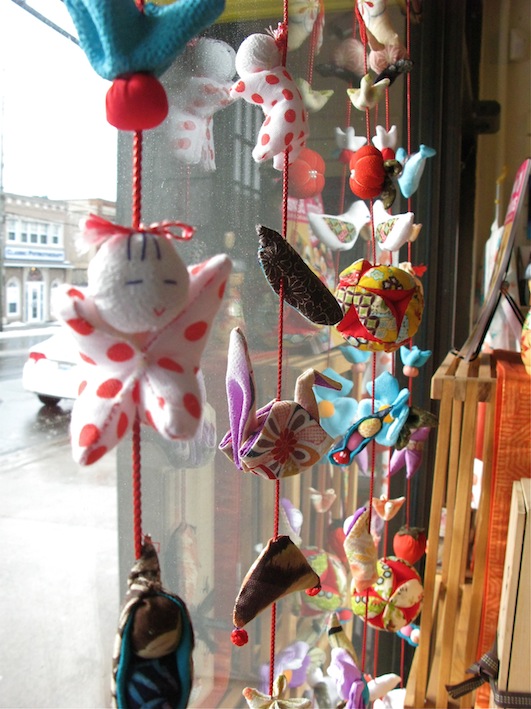
In celebration of Girls’ Day (Mar 3rd), we display these hanging stuffed ornaments called tsurushi-bina. Mothers hand-make them as a prayer for the health and well-being of their daughters.